Building Interactive Data Visualizations with D3.js

TL;DR
Learn how to create interactive data visualizations using D3.js with a step-by-step guide. This tutorial covers setting up an Express server, loading and filtering data from a CSV file, and building dynamic charts.
Repo: https://github.com/UncleDreiAI/D3.js-Pie-Chart-Example
Introduction
Data visualization is essential to modern web applications, providing users with insights through graphical data representations. D3.js is a powerful JavaScript library that enables developers to create interactive and dynamic data visualizations for the web. This tutorial will walk you through setting up an Express server, loading and filtering data from a CSV file, and building a dynamic chart using D3.js.
Key Topics Covered
- Setting Up the Project: Initialize and set up an Express server.
- Loading and Filtering Data: Loading data from a CSV file and applying filters.
- Building the Chart: Creating a dynamic chart using D3.js.
- Handling User Interactions: Adding interactivity to the chart with mouse events.
- Styling the Visualization: Applying CSS styles to enhance the visual appeal of the chart.
Setting Up the Project
First, we must set up our project directory and initialize a Node.js project. We'll use Express to serve our static files and handle routing.
Project Structure
d3_test/
│
├── public/
│   ├── scripts/
│   │   ├── main.js
│   ├── styles.css
│   ├── index.html
├── server.js
├── package.json
└── package-lock.json
package.json
{
  "name": "d3_test",
  "version": "1.0.0",
  "main": "server.js",
  "scripts": {
    "start": "node server.js",
    "dev": "nodemon server.js"
  },
  "dependencies": {
    "express": "^4.19.2",
    "nodemon": "^3.1.0"
  }
}
Loading and Filtering Data
We'll load data from a CSV file and filter it to prepare for visualization. The d3.csv function helps us load the CSV file, and we apply filters to clean and structure the data.
main.js
d3.csv("FruitTest20240401.csv").then((data) => {
  filteredData = dataFilter(data);
  buildChart(filteredData[currentPage]);
});
Building the Chart
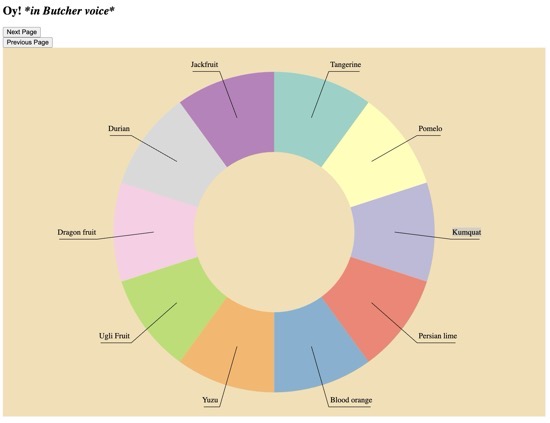
Using D3.js, we build a dynamic pie chart that visualizes the filtered data. We define the dimensions and create arcs for the pie slices.
main.js
function buildChart(filteredData) {
  const svg = d3.select("#mySvg").attr("width", width).attr("height", height);

  let g = svg.append("g").attr("transform", `translate(${width / 2}, ${height / 2})`);

  let pie = d3.pie().value((d) => d.Count)(filteredData);

  arc = d3.arc().innerRadius(radius / 2).outerRadius(radius);

  arcHover = d3.arc().innerRadius(radius / 2 - 10).outerRadius(radius + 20);

  let arcs = g.selectAll(".arc").data(pie).enter().append("g").attr("class", "arc");

  arcs.append("path")
    .attr("fill", (d, i) => d3.schemeSet3[i % d3.schemeSet3.length])
    .attr("d", arc)
    .on("mouseover", mouseOver)
    .on("mouseout", mouseOut)
    .on("mousemove", mouseMove);
}
Handling User Interactions
We add interactivity to our chart by handling mouse events, such as mouseOver, mouseOut, and mouseMove, to display tooltips and enhance user experience.
main.js
function mouseOver(event, d) {
  d3.select(this).transition().duration(500).attr("d", arcHover);
  tooltip.style("opacity", 1).html(`Type: ${d.data.Fruit}<br/>Value: ${d.data.AvgCost}`)
    .style("left", event.pageX + "px").style("top", event.pageY - 10 + "px");
}

function mouseOut(event, d) {
  d3.select(this).transition().duration(500).attr("d", arc);
  tooltip.style("opacity", 0);
}

function mouseMove(event, d) {
  tooltip.style("left", event.pageX + 10 + "px").style("top", event.pageY - 10 + "px");
}
Styling the Visualization
We use CSS to style our visualization, making it visually appealing and ensuring it fits well within our web page.
styles.css
#mySvg {
  background-color: wheat;
}

.outerArc {
  fill: none;
  stroke: none;
  stroke-width: 2;
}
Conclusion
Following this tutorial, you've learned how to set up an Express server, load, and filter data from a CSV file, and build an interactive chart using D3.js. These skills are valuable for creating dynamic data visualizations that enhance any web application.
FAQ
Q: What is D3.js?
A: D3.js is a JavaScript library for creating dynamic and interactive data visualizations in web browsers.
Q: Why use Express in this project?
A: Express serves static files and handles routing, making it easier to manage and deploy the application.
Q: How do I load data from a CSV file using D3.js?
A: Use the d3.csv function to load CSV data and then process it as needed for visualization.